Financial performance1
R$ million | 2011 | 2012 | 2013 | 2014 | 2015 |
Ultrapar | |||||
Net revenues from sales and services | 48,629 | 53,869 | 60,940 | 67,736 | 75,655 |
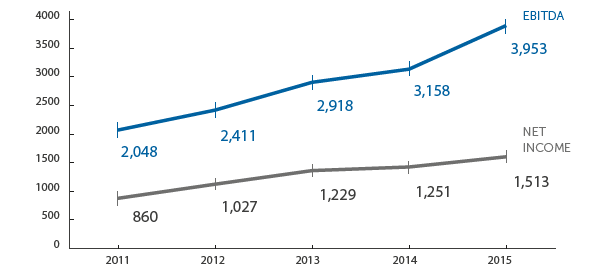
EBITDA | 2,048 | 2,411 | 2,918 | 3,158 | 3,953 |
Net income | 860 | 1,027 | 1,229 | 1,251 | 1,513 |
Investments4 | 1,013 | 1,310 | 1,089 | 1,220 | 1,352 |
Dividends declared | 525 | 627 | 744 | 779 | 871 |
Earnings per share (R$) | 1.60 | 1.90 | 2.28 | 2.26 | 2.74 |
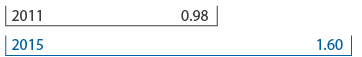
Dividends paid per share (R$) | 0.98 | 1.17 | 1.37 | 1.42 | 1.60 |
Ipiranga | |||||
Sales volume (‘000 m³) | 21,701 | 23,364 | 24,758 | 25,614 | 25,725 |
Net revenues from sales and services | 42,222 | 46,829 | 53,384 | 58,830 | 65,350 |
EBITDA | 1,366 | 1,653 | 2,030 | 2,288 | 2,769 |
Investments | 591 | 942 | 746 | 815 | 872 |
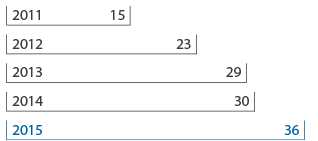
Productivity (EBITDA R$/m³) | 63 | 71 | 82 | 89 | 108 |
Oxiteno | |||||
Sales volume (‘000 ton) | 660 | 761 | 776 | 780 | 725 |
Net revenues from sales and services | 2,409 | 2,929 | 3,278 | 3,414 | 4,082 |
EBITDA | 262 | 352 | 441 | 404 | 740 |
Investments | 107 | 115 | 139 | 114 | 131 |
Productivity (EBITDA US$/ton) | 237 | 236 | 263 | 220 | 306 |
Ultragaz | |||||
Sales volume (‘000 ton) | 1,652 | 1,681 | 1,696 | 1,711 | 1,697 |
Net revenues from sales and services | 3,767 | 3,847 | 3,982 | 4,091 | 4,621 |
EBITDA | 281 | 246 | 281 | 306 | 357 |
Investments | 182 | 157 | 151 | 181 | 220 |
Productivity (EBITDA R$/ton) | 170 | 146 | 165 | 179 | 210 |
Ultracargo | |||||
Average storage (‘000 m³) | 582 | 614 | 696 | 715 | 655 |
Net revenues from sales and services | 260 | 294 | 332 | 346 | 316 |
EBITDA | 117 | 143 | 158 | 167 | 26 |
Investments | 107 | 82 | 37 | 26 | 24 |
Extrafarma² | |||||
Number of stores | 223 | 254 | |||
Gross revenues | 1,171 | 1,417 | |||
EBITDA | 30 | 29 | |||
Investments | 57 | 81 | |||
Capital markets | |||||
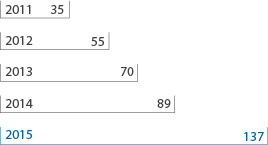
Average daily trading volume (R$ 000)³ | 34,646 | 55,498 | 69,874 | 88,577 | 136,671 |
Price at BM&FBovespa (R$/share) | 32.01 | 46.29 | 55.95 | 51.45 | 60.45 |
Price at NYSE (US$/ADR) | 17.20 | 22.28 | 23.65 | 19.07 | 15.52 |
1 The financial information presented in this document has been prepared according to International Financial Reporting Standards (IFRS) and EBITDA’s figures was prepared in accordance with ICVM 527. Ultrapar’s financial information corresponds to the company’s consolidated information. The financial information of Ipiranga, Oxiteno, Ultragaz, Ultracargo and Extrafarma is reported without elimination of intercompany transactions. Except where otherwise indicated, figures are presented in R$ millions.
2 In 2014, refer exclusively to the months from February to December.
3 Average daily trading volume presented considers the combined trading on the BM&FBovespa and the NYSE.
4 Organic investments.
12%
average annual growth of net revenues in the last five years
18%
average annual growth of EBITDA in the last five years
15%
average annual growth of net income in the last five years
R$ 6 bi
invested in our businesses in the last five years
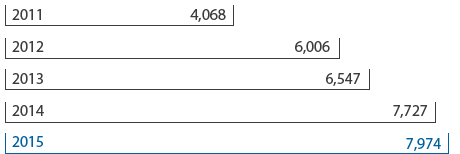
SHAREHOLDERS’ EQUITY R$ million
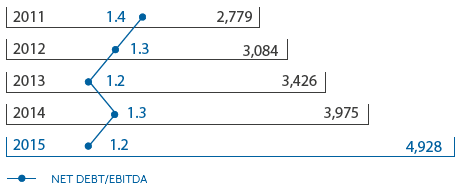
NET DEBT R$ million
CONSOLIDATED EBITDA AND NET INCOME PROGRESSION R$ million
Dividends paid per share R$
Key indicators
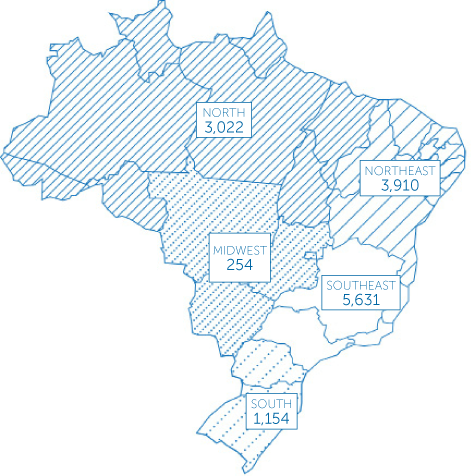
NATIONAL PRESENCE
26
states and the Federal District where Ultra is present
85%
Brazilian municipalities are reached by some Ultra’s activity
Number of employees by region
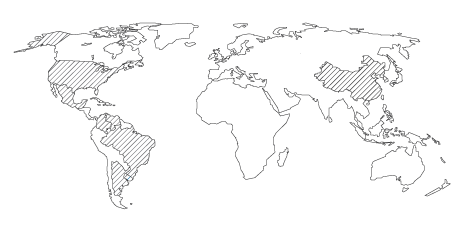
+8
countries
626
international employees
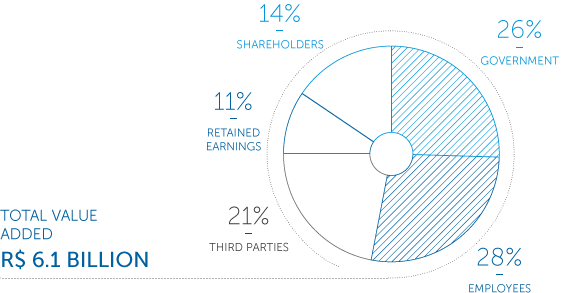
VALUE DISTRIBUTION
The Statement of Value Added reports the value of the wealth generated by the company and the distribution among the agents that contributed to its performance. Ultrapar generated value added of R$ 6.1 billion in 2015 and R$ 5.0 billion in 2014, distributed as follows:
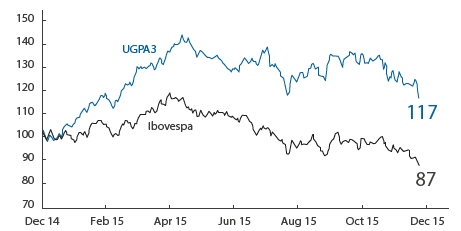
CAPITAL MARKETS
PERFORMANCE OF UGPA3 x IBOVESPA (BASE 100:31/12/2014)
DAILY TRADING VOLUME R$ million
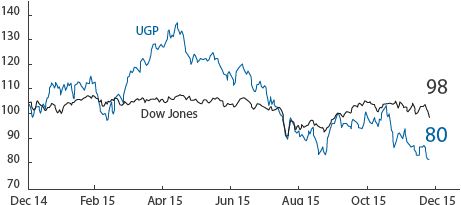
PERFORMANCE OF UGP x DOW JONES (BASE 100:31/12/2014)
MARKET CAPITALIZATION1 R$ billion
1 Calculated based on the weighted average price of the period.